 |
 |
 Interpreting SAR Images
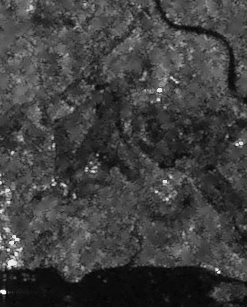
SAR ImagesSynthetic Aperture Radar(SAR) images can be obtained from satellites such as ERS, JERS and RADARSAT. Since radar interacts with the ground features in ways different from the optical radiation, special care has to be taken when interpreting radar images.An example of a ERS SAR image is shown below together with a SPOT multispectral natural colour composite image of the same area for comparison.
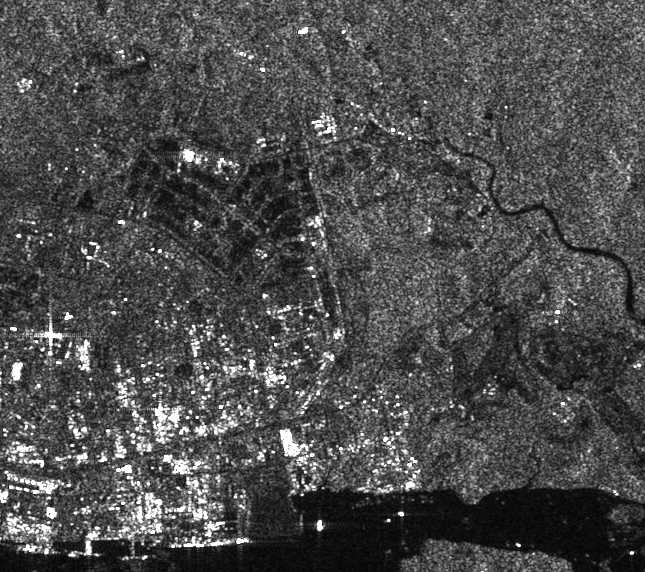
ERS SAR image (pixel size=12.5 m) 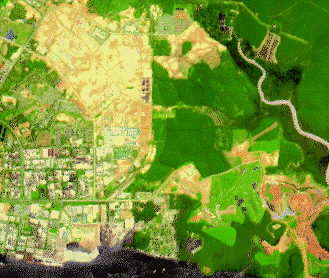
SPOT Multispectral image in Natural Colour (pixel size=20 m) The urban area on the left appears bright in the SAR image while the vegetated areas on the right have intermediate tone. The clearings and water (sea and river) appear dark in the image. These features will be explained in the following sections. The SAR image was acquired in September 1995 while the SPOT image was acquired in February 1994. Additional clearings can be seen in the SAR image.
Speckle NoiseUnlike optical images, radar images are formed by coherent interaction of the transmitted microwave with the targets. Hence, it suffers from the effects of speckle noise which arises from coherent summation of the signals scattered from ground scatterers distributed randomly within each pixel. A radar image appears more noisy than an optical image. The speckle noise is sometimes suppressed by applying a speckle removal filter on the digital image before display and further analysis.
Backscattered Radar IntensityA single radar image is usually displayed as a grey scale image, such as the one shown above. The intensity of each pixel represents the proportion of microwave backscattered from that area on the ground which depends on a variety of factors: types, sizes, shapes and orientations of the scatterers in the target area; moisture content of the target area; frequency and polarisation of the radar pulses; as well as the incident angles of the radar beam. The pixel intensity values are often converted to a physical quantity called the backscattering coefficient or normalised radar cross-section measured in decibel (dB) units with values ranging from +5 dB for very bright objects to -40 dB for very dark surfaces.
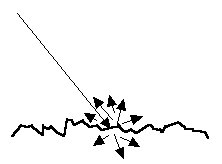
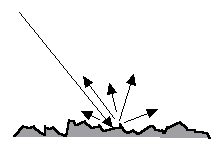
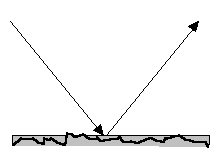
Interpreting SAR ImagesInterpreting a radar image is not a straightforward task. It very often requires some familiarity with the ground conditions of the areas imaged. As a useful rule of thumb, the higher the backscattered intensity, the rougher is the surface being imaged.Flat surfaces such as paved roads, runways or calm water normally appear as dark areas in a radar image since most of the incident radar pulses are specularly reflected away.
Calm sea surfaces appear dark in SAR images. However, rough sea surfaces may appear bright especially when the incidence angle is small. The presence of oil films smoothen out the sea surface. Under certain conditions when the sea surface is sufficiently rough, oil films can be detected as dark patches against a bright background.
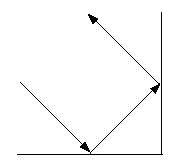
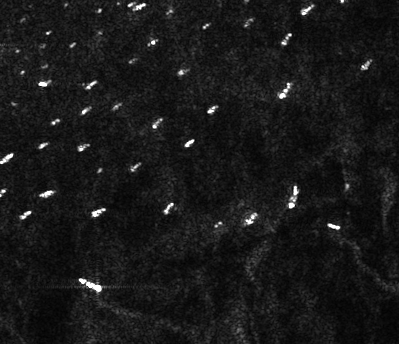
Trees and other vegetations are usually moderately rough on the wavelength scale. Hence, they appear as moderately bright features in the image. The tropical rain forests have a characteristic backscatter coefficient of between -6 and -7 dB, which is spatially homogeneous and remains stable in time. For this reason, the tropical rainforests have been used as calibrating targets in performing radiometric calibration of SAR images. Very bright targets may appear in the image due to the corner-reflector or double-bounce effect where the radar pulse bounces off the horizontal ground (or the sea) towards the target, and then reflected from one vertical surface of the target back to the sensor. Examples of such targets are ships on the sea, high-rise buildings and regular metallic objects such as cargo containers. Built-up areas and many man-made features usually appear as bright patches in a radar image due to the corner reflector effect.
The brightness of areas covered by bare soil may vary from very dark to very bright depending on its roughness and moisture content. Typically, rough soil appears bright in the image. For similar soil roughness, the surface with a higher moisture content will appear brighter.
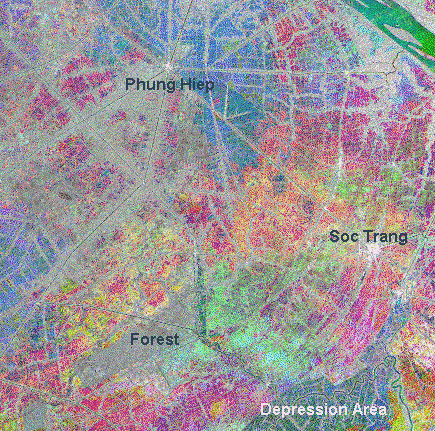
Multitemporal SAR imagesIf more than one radar images of the same area acquired at different time are available, they can be combined to give a multitemporal colour composite image of the area. For example, if three images are available, then one image can be assigned to the Red, the second to the Green and the third to the Blue colour channels for display. This technique is especially useful in detecting landcover changes over the period of image acquisition. The areas where no change in landcover occurs will appear in grey while areas with landcover changes will appear as colourful patches in the image.
 Microwave Remote Sensing 
 Image Processing and Analysis Image Processing and Analysis
 Go to Main Index Go to Main Index
|

