 |
 |
 Digital Image
 Analog and Digital ImagesAn image is a two-dimensional representation of objects in a real scene. Remote sensing images are representations of parts of the earth surface as seen from space. The images may be analog or digital. Aerial photographs are examples of analog images while satellite images acquired using electronic sensors are examples of digital images.
PixelsA digital image comprises of a two dimensional array of individual picture elements called pixels arranged in columns and rows. Each pixel represents an area on the Earth's surface. A pixel has an intensity value and a location address in the two dimensional image.The intensity value represents the measured physical quantity such as the solar radiance in a given wavelength band reflected from the ground, emitted infrared radiation or backscattered radar intensity. This value is normally the average value for the whole ground area covered by the pixel. The intensity of a pixel is digitised and recorded as a digital number. Due to the finite storage capacity, a digital number is stored with a finite number of bits (binary digits). The number of bits determine the radiometric resolution of the image. For example, an 8-bit digital number ranges from 0 to 255 (i.e. 28 - 1), while a 11-bit digital number ranges from 0 to 2047. The detected intensity value needs to be scaled and quantized to fit within this range of value. In a Radiometrically Calibrated image, the actual intensity value can be derived from the pixel digital number. The address of a pixel is denoted by its row and column coordinates in the two-dimensional image. There is a one-to-one correspondence between the column-row address of a pixel and the geographical coordinates (e.g. Longitude, latitude) of the imaged location. In order to be useful, the exact geographical location of each pixel on the ground must be derivable from its row and column indices, given the imaging geometry and the satellite orbit parameters.
Multilayer ImageSeveral types of measurement may be made from the ground area covered by a single pixel. Each type of measurement forms an image which carry some specific information about the area. By "stacking" these images from the same area together, a multilayer image is formed. Each component image is a layer in the multilayer image.Multilayer images can also be formed by combining images obtained from different sensors, and other subsidiary data. For example, a multilayer image may consist of three layers from a SPOT multispectral image, a layer of ERS synthetic aperture radar image, and perhaps a layer consisting of the digital elevation map of the area being studied.
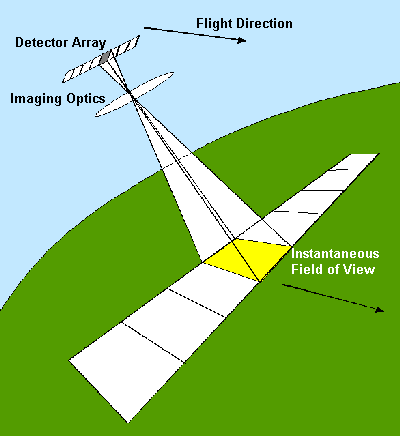
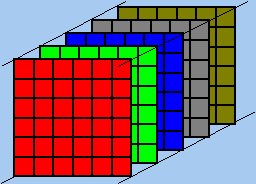
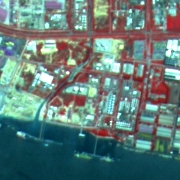
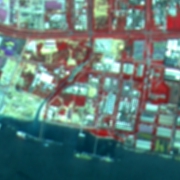
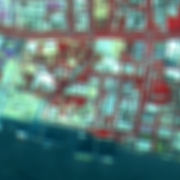
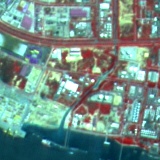
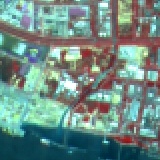
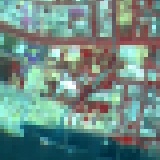
Multispectral ImageA multispectral image consists of a few image layers, each layer represents an image acquired at a particular wavelength band. For example, the SPOT HRV sensor operating in the multispectral mode detects radiations in three wavelength bands: the green (500 - 590 nm), red (610 - 680 nm) and near infrared (790 - 890 nm) bands. A single SPOT multispectral scene consists of three intensity images in the three wavelength bands. In this case, each pixel of the scene has three intensity values corresponding to the three bands. A multispectral IKONOS image consists of four bands: Blue, Green, Red and Near Infrared, while a landsat TM multispectral image consists of seven bands: blue, green, red, near-IR bands, two SWIR bands, and a thermal IR band. Superspectral ImageThe more recent satellite sensors are capable of acquiring images at many more wavelength bands. For example, the MODIS sensor on-board the NASA's TERRA satellite consists of 36 spectral bands, covering the wavelength regions ranging from the visible, near infrared, short-wave infrared to the thermal infrared. The bands have narrower bandwidths, enabling the finer spectral characteristics of the targets to be captured by the sensor. The term "superspectral" has been coined to describe such sensors.Hyperspectral ImageA hyperspectral image consists of about a hundred or more contiguous spectral bands. The characteristic spectrum of the target pixel is acquired in a hyperspectral image. The precise spectral information contained in a hyperspectral image enables better characterisation and identification of targets. Hyperspectral images have potential applications in such fields as precision agriculture (e.g. monitoring the types, health, moisture status and maturity of crops), coastal management (e.g. monitoring of phytoplanktons, pollution, bathymetry changes).Currently, hyperspectral imagery is not commercially available from satellites. There are experimental satellite-sensors that acquire hyperspectral imagery for scientific investigation (e.g. NASA's Hyperion sensor on-board the EO1 satellite, CHRIS sensor onboard ESA's PRABO satellite). 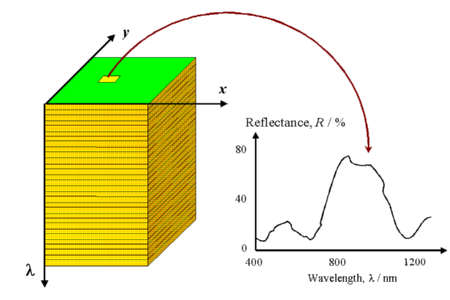 An illustration of a hyperspectral image cube. The hyperspectral image data usually consists of over a hundred contiguous spectral bands, forming a three-dimensional (two spatial dimensions and one spectral dimension) image cube. Each pixel is associated with a complete spectrum of of the imaged area. The high spectral resolution of hyperspectral images enables better identificaiton of the land covers. Spatial ResolutionSpatial resolution refers to the size of the smallest object that can be resolved on the ground. In a digital image, the resolution is limited by the pixel size, i.e. the smallest resolvable object cannot be smaller than the pixel size. The intrinsic resolution of an imaging system is determined primarily by the instantaneous field of view (IFOV) of the sensor, which is a measure of the ground area viewed by a single detector element in a given instant in time. However this intrinsic resolution can often be degraded by other factors which introduce blurring of the image, such as improper focusing, atmospheric scattering and target motion. The pixel size is determined by the sampling distance.A "High Resolution" image refers to one with a small resolution size. Fine details can be seen in a high resolution image. On the other hand, a "Low Resolution" image is one with a large resolution size, i.e. only coarse features can be observed in the image. 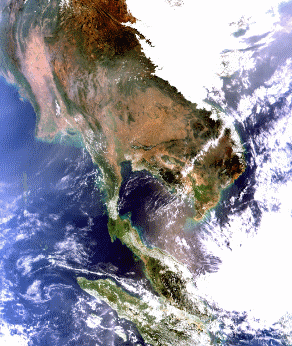 A low resolution MODIS scene with a wide coverage. This image was received by CRISP's ground station on 3 March 2001. The intrinsic resolution of the image was approximately 1 km, but the image shown here has been resampled to a resolution of about 4 km. The coverage is more than 1000 km from east to west. A large part of Indochina, Peninsular Malaysia, Singapore and Sumatra can be seen in the image. 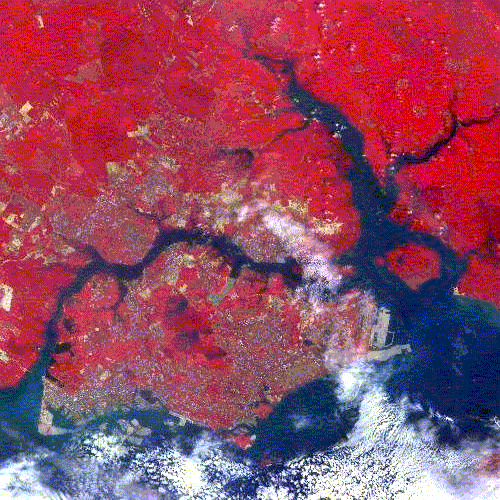 A browse image of a high resolution SPOT scene. The multispectral SPOT scene has a resolution of 20 m and covers an area of 60 km by 60 km. The browse image has been resampled to 120 m pixel size, and hence the resolution has been reduced. This scene shows Singapore and part of the Johor State of Malaysia. 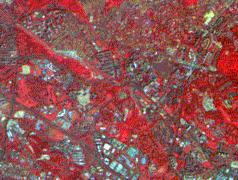 Part of a high resolution SPOT scene shown at the full resolution of 20 m. The image shown here covers an area of approximately 4.8 km by 3.6 km. At this resolution, roads, vegetation and blocks of buildings can be seen. 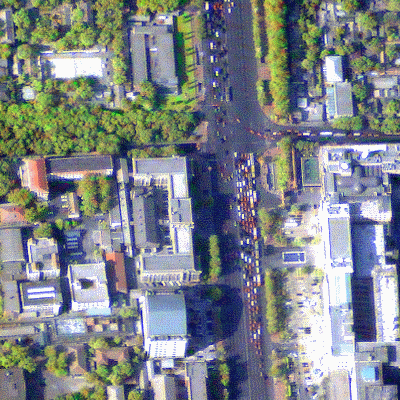 Part of a very high resolution image acquired by the IKONOS satellite. This true-colour image was obtained by merging a 4-m multispectral image with a 1-m panchromatic image of the same area acquired simultaneously. The effective resolution of the image is 1 m. At this resolution, individual trees, vehicles, details of buildings, shadows and roads can be seen. The image shown here covers an area of about 400 m by 400 m. A very high spatial resolution image usually has a smaller area of coverage. A full scene of an IKONOS image has a coverage area of about 10 km by 10 km. Spatial Resolution and Pixel SizeThe image resolution and pixel size are often used interchangeably. In realiaty, they are not equivalent. An image sampled at a small pixel size does not necessarily has a high resolution. The following three images illustrate this point. The first image is a SPOT image of 10 m pixel size. It was derived by merging a SPOT panchromatic image of 10 m resolution with a SPOT multispectral image of 20 m resolution. The merging procedure "colours" the panchromtic image using the colours derived from the multispectral image. The effective resolution is thus determined by the resolution of the panchromatic image, which is 10 m. This image is further processed to degrade the resolution while maintaining the same pixel size. The next two images are the blurred versions of the image with larger resolution size, but still digitized at the same pixel size of 10 m. Even though they have the same pixel size as the first image, they do not have the same resolution.
The following images illustrate the effect of pixel size on the visual appearance of an area. The first image is a SPOT image of 10 m pixel size derived by merging a SPOT panchromatic image with a SPOT multispectral image. The subsequent images show the effects of digitizing the same area with larger pixel sizes.
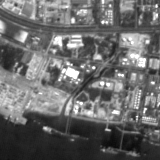
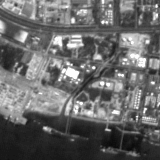
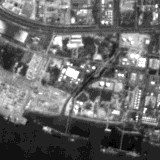
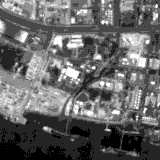
Radiometric ResolutionRadiometric Resolution refers to the smallest change in intensity level that can be detected by the sensing system. The intrinsic radiometric resolution of a sensing system depends on the signal to noise ratio of the detector. In a digital image, the radiometric resolution is limited by the number of discrete quantization levels used to digitize the continuous intensity value.The following images illustrate the effects of the number of quantization levels on the digital image. The first image is a SPOT panchromatic image quantized at 8 bits (i.e. 256 levels) per pixel. The subsequent images show the effects of degrading the radiometric resolution by using fewer quantization levels.
Digitization using a small number of quantization levels does not affect very much the visual quality of the image. Even 4-bit quantization (16 levels) seems acceptable in the examples shown. However, if the image is to be subjected to numerical analysis, the accuracy of analysis will be compromised if few quantization levels are used.
Data VolumeThe volume of the digital data can potentially be large for multispectral data, as a given area is covered in many different wavelength bands. For example, a 3-band multispectral SPOT image covers an area of about 60 x 60 km2 on the ground with a pixel separation of 20 m. So there are about 3000 x 3000 pixels per image. Each pixel intensity in each band is coded using an 8-bit (i.e. 1 byte) digital number, giving a total of about 27 million bytes per image.In comparison, the panchromatic data has only one band. Thus, panchromatic systems are normally designed to give a higher spatial resolution than the multispectral system. For example, a SPOT panchromatic scene has the same coverage of about 60 x 60 km2 but the pixel size is 10 m, giving about 6000 x 6000 pixels and a total of about 36 million bytes per image. If a multispectral SPOT scene is digitized also at 10 m pixel size, the data volume will be 108 million bytes. For very high spatial resolution imagery, such as the one acquired by the IKONOS satellite, the data volume is even more significant. For example, an IKONOS 4-band multispectral image at 4-m pixel size covering an area of 10 km by 10 km, digitized at 11 bits (stored at 16 bits), has a data volume of 4 x 2500 x 2500 x 2 bytes, or 50 million bytes per image. A 1-m resolution panchromatic image covering the same area would have a data volume of 200 million bytes per image. The images taken by a remote sensing satellite is transmitted to Earth through telecommunication. The bandwidth of the telecommunication channel sets a limit to the data volume for a scene taken by the imaging system. Ideally, it is desirable to have a high spatial resolution image with many spectral bands covering a wide area. In reality, depending on the intended application, spatial resolution may have to be compromised to accommodate a larger number of spectral bands, or a wide area coverage. A small number of spectral bands or a smaller area of coverage may be accepted to allow high spatial resolution imaging. Spaceborne Remote Sensing   Optical Remote Sensing Optical Remote Sensing Go to Main Index Go to Main Index |
