Displayed bands - (R:Short-wave Infrared, G:Near-Infrared, B:Green)
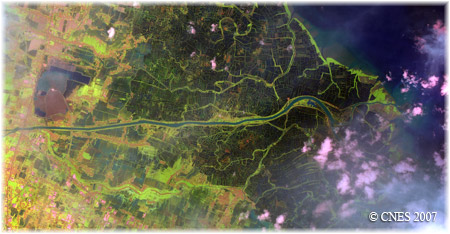
The satellite images below show the area that is affected by the mud flow that started in May 2006.
Image visible extent : approx. 7 km x 7 km
Full extent (navigable) : approx. 23.04 km x 11.99 km
Displayed bands - (R:Short-wave Infrared, G:Near-Infrared, B:Green)
Images' Copyright : © CNES 2007
Post a comment / message for the images shown concerning the mud flow. Your comment / message will be reviewed and considered for posting on our webpage. Email addresses submitted will not be displayed at our site. Email address submitted enable us to alert you if others see your comments and have questions for you. Thank you.