Top image (R:Short-wave Infrared, G:Near-Infrared, B:Green); bottom image (R:Hue, G:Saturation, B:Value)
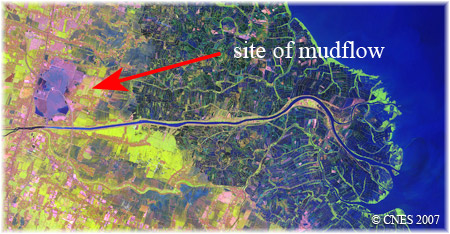
The satellite images below show the area that is affected by the mud flow that started in May 2006. Both are of the same image but displayed in different colour space. We are experimenting with the display of satellite images in HSV colour (USGS Munsell). For the images shown below, the displayed bands for the upper image is (R:Short-wave Infrared, G:Near-Infrared, B:Green); for the lower image, (R:Hue, G:Saturation, B:Value). You are welcome to share with us your knowledge of USGS Munsell colour system and its application in satellite images. Any comments on the HSV colour image shown below are also welcomed.
Image visible extent : approx. 7 km x 3.5 km
Full extent (navigable) : approx. 23.04 km x 11.99 km
Top image (R:Short-wave Infrared, G:Near-Infrared, B:Green); bottom image (R:Hue, G:Saturation, B:Value)
Post a comment / message for the images shown concerning the mud flow. Your comment / message will be reviewed and considered for posting on our webpage. Email addresses submitted will not be displayed at our site. Email address submitted enable us to alert you if others see your comments and have questions for you. Thank you.