Forest/Land Fires in Southeast AsiaBiomass burning has been the traditional method of clearing land for shifting cultivation in Southeast Asia. However, the small scale clearing of land is increasingly being replaced by modern large-scale conversion of forests into plantations/agricultural land, usually by fires (Goldammer 1997). In periods of extreme drought, especially those associated with the El Nino Southern Oscillation (ENSO) phenomenon, the fires get out of control resulting in severe transboundary air pollution in the form of smoke haze.In Southeast Asia, forest fire events occurred during the dry seasons in 1982-83, 1987, 1991, 1994 and 1997-98. In the 1982-83 forest fire event, it has been reported that 5 million hectares of primary and secondary rain forests in Borneo was affected by the fires. The recent one in 1997 was especially severe, causing many countries in Southeast Asia to be affected by thick smoke haze. |
||||||||||||||||||||||||||||||||||||||||||||||||||
Remote Sensing Satellites For Fire Detection and MonitoringSatellite remote sensing offers a useful tool for fire monitoring, management and damage assessment. In satellite remote sensing, information about the earth's surface and atmosphere is acquired using sensors mounted on-board satellites orbiting the earth.In comparison to the conventional methods of information gathering, satellite remote sensing provides the following advantages,
|
||||||||||||||||||||||||||||||||||||||||||||||||||
|
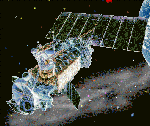
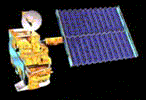
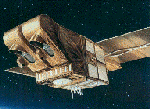
The following satellite-sensor systems are commonly used in fire detection and monitoring: NOAA-AVHRR
DMSP-OLS
Terra-MODIS
Landsat-TM
SPOT-HRV/HVIR
|
||||||||||||||||||||||||||||||||||||||||||||||||||
Detection of fires and fire-affected areasHeat EmissionDuring a fire event, the heat emitted by active fires can be detected by infrared sensors on-board a satellite. This procedure is commonly known as 'hot spot detection'. Fire hot spots can be detected and monitored during a fire event to provide information on the general locations, spatial distributions and temporal evolution of fire.The AVHRR sensors on board the NOAA Polar Orbiting Environment Satellites are commonly used to detect heat emission from fires for the construction of fire hotspot distribution maps.
Limitations of AVHRR for Fire Detection
Light EmissionThe US Air Force (USAF) Defence Meteorological Satellite Program (DMSP) operates a series of satellites which carry very sensitive light sensors known as the Operational Linescan System (OLS) that can detect light emission from the earth surface at night. The digital data from DMSP-OLS were archived at NOAA's National Geophysical Data Center (NGDC) since 1992. The USAF initially imposed a 72 hours embargo on the DMSP-OLS before they could be released by NOAA. Since 21 Dec 1999, the 72 hours hold has been relaxed to 3 hours. The DMSP-OLS has a ground swath of about 3000 km. It has two broad spectral bands, one covering the visible-near infrared region (0.5 - 0.9 mm) and the other is in the thermal infrared region around 10 mm. The OLS data are acquired in two spatial resolution modes: 'fine' and 'smoothed'. The full resolution fine data have a nominal spatial resolution of 0.56 km. On board averaging of five by five blocks of fine data produces "smoothed" data with a nominal spatial resolution of 2.7 km. Most of the data received by NOAA-NGDC is in the smoothed spatial resolution mode. The DMSP-OLS data are also available from NOAA SAA. The DMSP-OLS has a unique capability to observe faint sources of visible- near infrared emissions present at night on the Earth's surface, including cities, towns, villages, gas flares, heavily lit fishing boats and fires. By analysing a time series of DMSP-OLS images, it is possible to define a reference set of "stable" lights, which are present in the same location on a consistent basis. Fires are identified as lights detected on the land surface outside the reference set of stable lights. Due to the coarse resolution of the smoothed OLS data, they have similar limitations as the AVHRR data for fire detection. For example, it is not possible to determine the number of fires, locations of individual fires and fire size within an identified fire hotspot. Furthermore, smouldering fire or fire burning below the canopy will not be detected by OLS. Smoke PlumesSmoke plumes in optical remote sensing images are direct telltale signs of active fires. The can be visually identified in an image as some fuzzy bright strips, usually conical in shape converging to a point on the ground. If more than one plumes are visible, the plumes all orientated in a general direction along the direction of the wind. In high resolution images such as those acquired by the SPOT satellites, the precise locations of the active fires can be determined from the points of origin of the individual smoke plumes. Large smoke plumes can also be observed from relatively low-resolution sensors such as the ones on-board a meteorological satellite. The distribution of these smoke plumes, together with the prevailing wind conditions, provide early warnings for the possible spreading of smoke haze to the neighbouring regions. Burned AreaFire affected areas can be discriminated in a remote sensing image due to the strong contrast with the unburned areas. Burn scar maps derived from remote sensing images provide information on the spatial extent and distribution of the fire affected areas, and the total area burned. The burned area, together with land cover information, provide the basis for estimating emission of carbon dioxide and other gases implicated for global climate change, and for assessment of fire damage to the economy and environment. Land cover maps can be derived from remote sensing images using reflectance signatures of the various land cover types. The land cover maps are useful in ascertaining the types of land affected by fires during a fire event for effective fire fighting and fire management, and for damage assessment. |
||||||||||||||||||||||||||||||||||||||||||||||||||
Near Real-Time Forest/Land Fire Monitoring OperationAn on-going regional land/forest fire monitoring operation is conducted at CRISP, in collaboration with the Ministry of Environment, Singapore. This operation makes use of both the wide coverage AVHRR and high resolution SPOT images in detecting fires in the region. Based on the daily "hot-spot" data derived from NOAA-AVHRR, SPOT satellites are programmed to acquire "zoom-in" views of the fire areas. Daily reports on fires and smoke plumes, with selected annotated images, are forwarded to the Ministry of the Environment.With SPOT images, it is possible to accurately locate each of the fires and smoke plumes, to tell if the fires are in forests, peat swamps, or plantations, and if they are associated with activities such as clearing of agricultural land or timber logging sites. |
||||||||||||||||||||||||||||||||||||||||||||||||||
|
(i) SPOT Images for Near Real Time Forest Fire Monitoring ; (ii) Commonly used Satellite Sensors |

