SPOT Images for Near Real Time Forest Fire MonitoringOo Kaw LIM, Soo Chin LIEW, Leong Keong KWOH and Hock LIMCentre for Remote Imaging, Sensing and Processing (CRISP) National University of Singapore Lower Kent Ridge Road, Singapore 119260, Republic of Singapore Tel : (65) 874 3220 Fax : (65) 775 7717 Email : crisp@nus.edu.sg |
| Land/forest fires are persistent in many tropical countries in South America, Southeast Asia and Africa. In times of severe droughts, the fires may go out of control resulting in massive destruction of tropical forests and severe transboundary pollution in the form of smoke haze. In Southeast Asia, the economic damage due to the 1997 land/forest fires has been estimated to exceed four billion US dollars. Since March 1998, the Centre for Remote Imaging, Sensing and Processing (CRISP) in Singapore has been engaged in performing daily fire monitoring over the Southeast Asian region using SPOT imagery. Thanks to the oblique viewing capability, it is possible to have almost daily coverage (with SPOT-1, 2, 4) of any location in the region by the SPOT satellites. Implementation of a Direct Ingest System enables the SPOT images downlinked to be processed and analysed in near real time. A report and annotated images on the locations of fires, extent of burnt areas and other relevant information are ready in five to six hours after the reception of SPOT data. |
CRISP's Ground StationThe Centre for Remote Imaging, Sensing and Processing (CRISP) at the National University of Singapore operates a remote sensing ground station since September 1995. It has been receiving data from the SPOT, ERS and RADARSAT satellites. The reception circle of CRISP’s ground station covers the whole of Southeast Asian region. To date, more than 200,000 scenes of SPOT images have been archived. A World Wide Web catalogue-browse system (http://www.crisp.nus.edu.sg) allows users to search the complete archive, with location maps and quicklook images available online. |
The Southeast Asian Land/Forest Fires of 1997 and 1998In the periods May-November 1997 and February-April 1998, extensive land/forest fires raged out of control through various parts of Southeast Asia. Thick smoke haze covered the region for months, causing health hazard and an estimated loss in excess of US 4 billion. During the period, CRISP and Meteorological Service Singapore (MSS) jointly assisted the Ministry of the Environment of Singapore to monitor the regional fires with remote sensing images. Daily, MSS acquired NOAA AVHRR and GMS images, and process "hotspot" maps from the AVHRR data. The images and hotspot maps are posted on an intranet for access by authorised users. CRISP used SPOT images to zoom in onto the hotspot areas to accurately locate the individual fires and to determine where possible the nature of the fires. Daily, passes of SPOT images are inspected and reports of fires with annotated images are sent to the Ministry of the Environment. Selected images are also sent to the Malaysian Centre for Remote Sensing (MACRES) under an agreement between SPOT ASIA and MACRES. A few hardware and software developments have enabled CRISP to efficiently perform this fire monitoring operation in near real-time:
|
Using SPOT Images in Fire MonitoringThe AVHRR sensors on board the NOAA Satellites are conventionally used in monitoring land/forest fires. In particular, the 3.8 mm infrared band (Band 3) is used in hot spot detection. Unfortunately, AVHRR images have coarse resolution and give rise to frequent false alarms. To more accurately locate the fires and to determine where possible the nature of fires, CRISP has since mid-1997 been using SPOT images to monitor the fires in the Southeast Asian region. 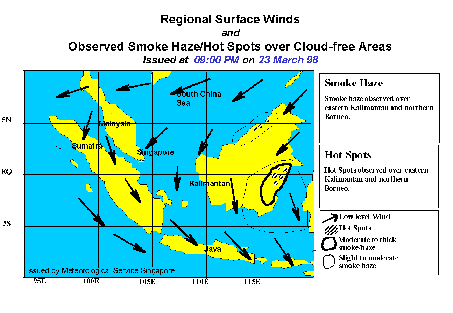
Daily, CRISP downloads from the website of the Meteorological Service Singapore (MSS) the AVHRR images and the derived hotspot images (Figure 1). These images give the general locations of current fires. SPOT passes of the next day are then programmed to steer the sensors to zoom in onto the fires. If fires are detected in the SPOT scenes, CRISP will continue to programme the SPOT satellites over the areas for the next few days to monitor the development of the fires. With SPOT-1 and SPOT-2, any given location can be observed with a repeat interval of two to three days. When CRISP starts acquiring SPOT-4 data in the near future, almost daily coverage will be possible. Figure 2 shows a schematic map of a SPOT pass with the programmed segments for fire observation. 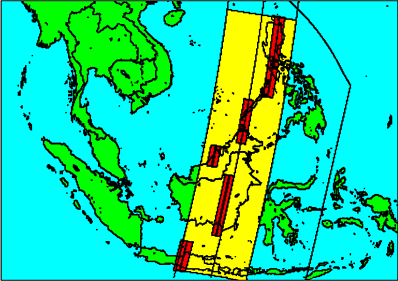
|
Near Real-time Prcessing of SPOT Satellite DataThe reception facility of CRISP is equipped with a Direct Ingest System (DIS) which stores the downlinked satellite signal directly onto hard disk (Figures 3 and 4). The satellite signal is simultaneously recorded onto high density tapes with a pair of Sony DIR recorders as a backup. Immediately after a pass, the received data stored in the DIS are processed into long image strips of full resolution (data collected in each segment become one image strip). These full-resolution image strips in general are available for fire detection work within 10 minutes of the satellite passes. 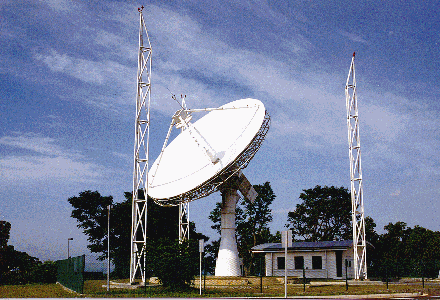 Figure 3 : CRISP’s 13-m satellite tracking antenna dish. 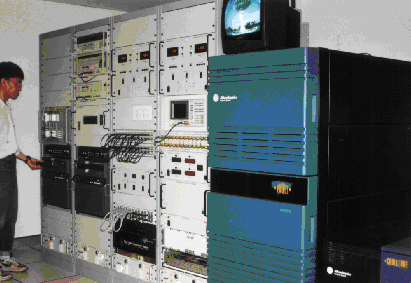
|
Fire Detection with Full-Resolution SPOT ImageryFire detection is carried out by visual inspection of the full resolution image strips. This operation is made possible by a visualisation software developed in-house in CRISP (Figure 5). This software reads in a complete full-resolution image strip, often covering an area of 120 km x 1,000 km, and displays a low-resolution overview image on the left edge of the screen. Within the display, there is a small rectangle, and the full-resolution image of the area within the rectangle is shown on the rest of the computer screen. By moving the small rectangle within the overview image with the mouse, the complete image strip can be systematically checked for signs of fires. The more easily detected tell-tale signs of fires are the smoke plumes and burnt scars. Smoke plumes generated by fires can be readily distinguished from clouds by their characteristics shapes and the bluish hue. Burnt scars appear black in colour and are usually present beside a smoke plume. 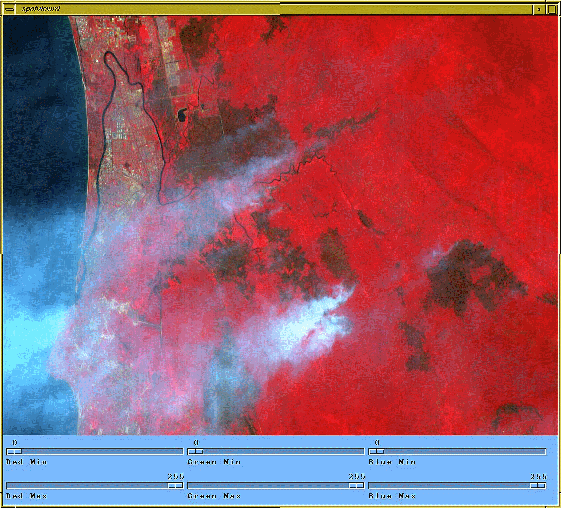
|
Fire Reports with Annotated ImagesAfter visual detection of fires, SPOT scenes covering the fire areas are processed to Level 1B. To meet the fast delivery requirement of the fire monitoring operation, CRISP's SPOT processing software has been modified to enable it to produce Level 1B products within 10 to 15 minutes. The detected fire spots are then labeled on the processed image. Date, time, location map and scale bar are included in each image for easy reference (Figure 6). 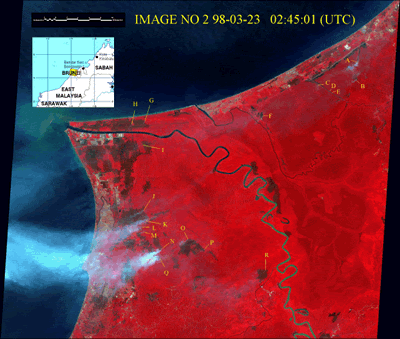 Figure 6: An annotated image.showing locations of detected fires. 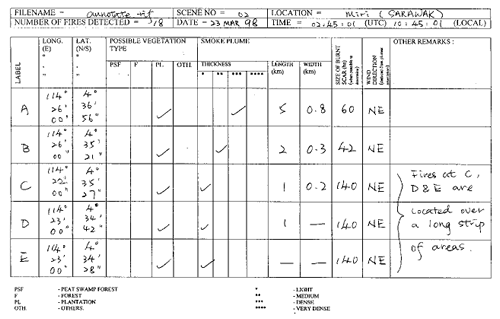
A fire report is also made (Figure 7) which lists for each detected fire: the accurate location (longitude and latitude), smoke plume condition (length, width and thickness), wind direction, the type of landcover on fire (forest, plantation, peat swamp, etc.) and the extent of burnt scar associated with the fire. The fire reports and annotated images are ready for delivery within five to six hours after the initial SPOT data reception. |
ConclusionsWith the frequent revisit capability of SPOT satellites and CRISP's near real time reception and processing facilities, the fire monitoring operation at CRISP has been very successful in providing valuable information on fire activities in the region. Fire reports and annotated fire images can be delivered within five to six hours after data reception. With the use of high-resolution SPOT images, accurate locations of the fire affected areas can be determined to facilitate fire-fighting operation. The informations provided can also help in management of fire affected areas and prevention of future fires. We believe the technique developed can play an important complementary role to existing fire detection and monitoring systems. |
|
(i) Commonly used Satellite Sensors (ii) Back to content page |