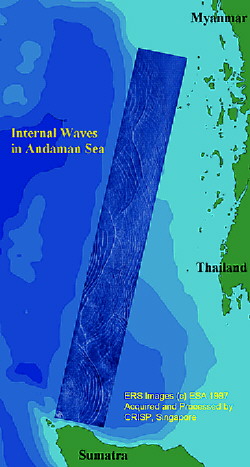
The internal waves modulate the overlying surface waves and the sea
surface manifestations of internal waves are readily observed in
synthetic aperture radar (SAR)
images. They appear as alternating bright and dark bands
corresponding to regions of increased surface roughness (bright)
alternating with smooth regions (dark). Often they occur as packets
with 4 to 10 bright bands in each packet. What are internal waves?In the oceans the density of water may vary with depth due to variation in temperature and/or salinity. The density often changes sharply across a thin layer, separating warm, less saline surface water from cold, saline deep water. Disturbances such as tidal flows over bottom topography will cause waves to be generated at this interface. These internal waves may in turn modulate ocean surface waves, leading to stretches of increased surface roughness alternating with relatively smooth regions. When the amplitude is large, the internal waves often exhibit highly nonlinear characteristics, developing into packets of "solitons" with 4 to 10 solitons in each packets.Remote sensing investigation of internal waves
Internal waves in the Andaman SeaThe Andaman Sea (lying approximately between latitudes 5° N and 16° N, and longitudes 93° E and 98° E) is a basin bounded on the west by the Andaman and Nicobar islands; on the north and east by Myanmar, Thailand, and the Malayan Peninsula; and on the south by the Strait of Malacca and Sumatra. About 1,200 km long and 650 km wide, it covers an area of 798,000 sq km. Its maximal depth is about 4,360 m but its bottom is rather uneven.In the Andaman Sea, the internal waves are of such extraordinary amplitudes (up to 100 m) that they affect drill ship operations and threaten the safety of divers. A systematic study of the spatial distribution of the internal solitary waves in the Andaman Sea has been conducted to extract information on their generation and propagation characteristics. Evidence of phase shifts associated with soliton interactions has also been observed in the ERS images. RADARSAT scanSAR images, with their wider spatial coverage, provide additional information as more than two packets can be observed in a single scene. The first spectacular image observed at CRISP was acquired on Oct 6 1995, about a month after CRISP Ground station became operational in September 1995. It shows a wave crest stretching for about 300 km. During April and May 1996, in conjunction with the ERS-1/2 tandem missions, a total of 240 scenes were acquired from 27 descending passes. Out of these, radar signatures of internal solitons can be observed in 58 scenes. The interesting ones include:
A spectacularly long strip of about 900 km with many internal wave packets can seen in the Feb 11 1997 ERS-2 image of the Andaman Sea. A RADARSAT ScanSAR image acquired on 17 December 1997 shows many clear packets of internal waves colliding with each other, exhibiting many interesting features. Regularly spaced packets are generated by consecutive tidal cycles. Two internal wave packets are seen in this RADARSAT ScanSAR image acquired on 17 January 1997. A SPOT HRV1 multispectral image acquired on 5 May 1999 shows how internal waves can look on an optical image under favourable viewing conditions. ConclusionsSAR images of the Andaman Sea are an excellent means to study the spatial distribution and the form of the sea surface manifestation of internal solitons in the Andaman Sea. From them information on their generation and propagation characteristics can be derived. The analysis of 385 ERS-1/2 SAR images of the Andaman Sea has revealed that the internal solitons propagating westwards have their origin at shallow areas in the western section of the Andaman Sea where they are probably generated by the interaction of the baroclinic tide with shallow bottom topographic features. When solitary wave packets encounter the shallow waters of the western shelf of the Malayan Peninsula, they become heavily disturbed and the separations between the solitons in the wave packet decreases, but they remain solitons of depression. |
