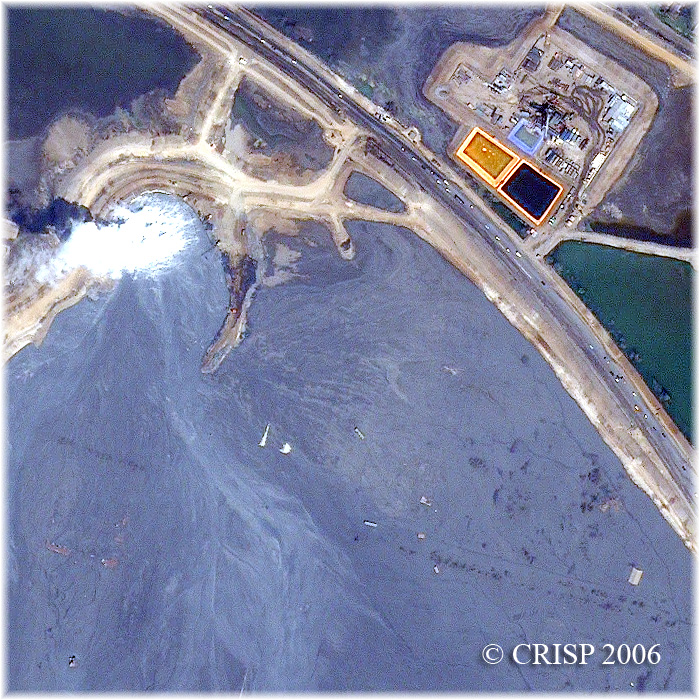
Higher resolution image (31 Oct 2006)
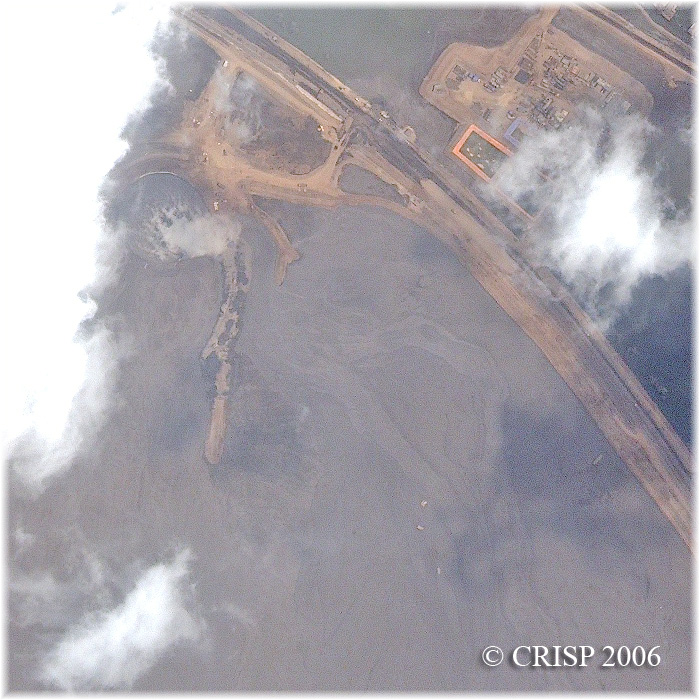
Higher resolution image (22 Nov 2006)
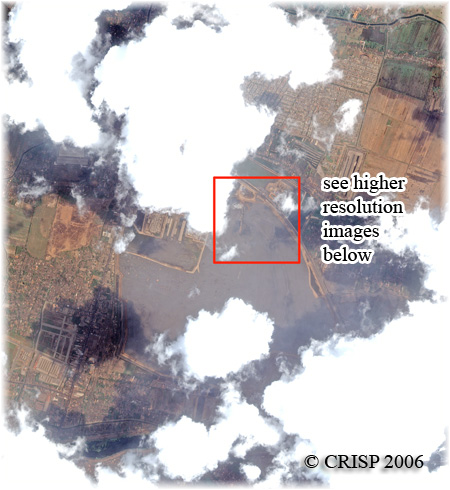
The satellite images in this page show the area that is affected by the mud flow that started in May 2006. The overview image shown above was taken on 22 Nov 2006 while the higher resolution images below were taken on 31 Oct and 22 Nov 2006.
Overview image : approx. 3.720 km x 4.120 km
higher resolution images : approx. 0.7 km x 0.7 km
Higher resolution image (31 Oct 2006)
Higher resolution image (22 Nov 2006)
* kmz link : The kmz link enables the viewing of the satellite images on Google Earth.
Images' Copyright : © CRISP 2006
Post a comment / message for the images shown concerning the mud flow. Your comment / message will be reviewed and considered for posting on our webpage. Email addresses submitted will not be displayed at our site. Email address submitted enable us to alert you if others see your comments and have questions for you. Thank you.