 |
 |
 Image Processing and Analysis
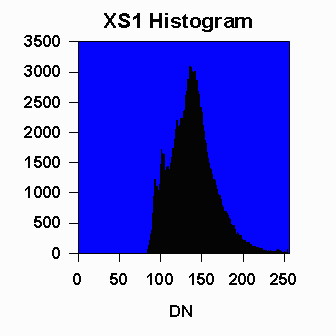
  Image Processing and AnalysisMany image processing and analysis techniques have been developed to aid the interpretation of remote sensing images and to extract as much information as possible from the images. The choice of specific techniques or algorithms to use depends on the goals of each individual project. In this section, we will examine some procedures commonly used in analysing/interpreting remote sensing images. Pre-ProcessingPrior to data analysis, initial processing on the raw data is usually carried out to correct for any distortion due to the characteristics of the imaging system and imaging conditions. Depending on the user's requirement, some standard correction procedures may be carried out by the ground station operators before the data is delivered to the end-user. These procedures include radiometric correction to correct for uneven sensor response over the whole image and geometric correction to correct for geometric distortion due to Earth's rotation and other imaging conditions (such as oblique viewing). The image may also be transformed to conform to a specific map projection system. Furthermore, if accurate geographical location of an area on the image needs to be known, ground control points (GCP's) are used to register the image to a precise map (geo-referencing).Image EnhancementIn order to aid visual interpretation, visual appearance of the objects in the image can be improved by image enhancement techniques such as grey level stretching to improve the contrast and spatial filtering for enhancing the edges. An example of an enhancement procedure is shown here. Multispectral SPOT image of the same area shown in a previous section, but acquired at a later date. Radiometric and geometric corrections have been done. The image has also been transformed to conform to a certain map projection (UTM projection). This image is displayed without any further enhancement. In the above unenhanced image, a bluish tint can be seen all-over the image, producing a hazy apapearance. This hazy appearance is due to scattering of sunlight by atmosphere into the field of view of the sensor. This effect also degrades the contrast between different landcovers. It is useful to examine the image Histograms before performing any image enhancement. The x-axis of the histogram is the range of the available digital numbers, i.e. 0 to 255. The y-axis is the number of pixels in the image having a given digital number. The histograms of the three bands of this image is shown in the following figures.  Histogram of the XS3 (near infrared) band (displayed in red).  Histogram of the XS2 (red) band (displayed in green).  Histogram of the XS1 (green) band (displayed in blue). Note that the minimum digital number for each band is not zero. Each histogram is shifted to the right by a certain amount. This shift is due to the atmospheric scattering component adding to the actual radiation reflected from the ground. The shift is particular large for the XS1 band compared to the other two bands due to the higher contribution from Rayleigh scattering for the shorter wavelength. The maximum digital number of each band is also not 255. The sensor's gain factor has been adjusted to anticipate any possibility of encountering a very bright object. Hence, most of the pixels in the image have digital numbers well below the maximum value of 255. The image can be enhanced by a simple linear grey-level stretching. In this method, a level threshold value is chosen so that all pixel values below this threshold are mapped to zero. An upper threshold value is also chosen so that all pixel values above this threshold are mapped to 255. All other pixel values are linearly interpolated to lie between 0 and 255. The lower and upper thresholds are usually chosen to be values close to the minimum and maximum pixel values of the image. The Grey-Level Transformation Table is shown in the following graph.  Grey-Level Transformation Table for performing linear grey level stretching of the three bands of the image. Red line: XS3 band; Green line: XS2 band; Blue line: XS1 band. The result of applying the linear stretch is shown in the following image. Note that the hazy appearance has generally been removed, except for some parts near to the top of the image. The contrast between different features has been improved.  Multispectral SPOT image after enhancement by a simple linear greylevel stretching. Image ClassificationDifferent landcover types in an image can be discriminated usingsome image classification algorithms using spectral features, i.e. the brightness and "colour" information contained in each pixel. The classification procedures can be "supervised" or"unsupervised".In supervised classification, the spectral features of some areas of known landcover types are extracted from the image. These areas are known as the "training areas". Every pixel in the whole image is then classified as belonging to one of the classes depending on how close its spectral features are to the spectral features of the training areas. In unsupervised classification, the computer program automatically groups the pixels in the image into separate clusters, depending on their spectral features. Each cluster will then be assigned a landcover type by the analyst. Each class of landcover is referred to as a "theme"and the product of classification is known as a "thematicmap". The following image shows an example of a thematic map. This map was derived from the multispectral SPOT image of the test area shown in a previous section using an unsupervised classification algorithm.  SPOT multispectral image of the test area  Thematic map derived from the SPOT image using an unsupervised classification algorithm. A plausible assignment of landcover types to the thematic classes is shown in the following table. The accuracy of the thematic map derived from remote sensing images should be verified by field observation.
The spectral features of these Landcover classes can be exhibited in two graphs shown below. The first graph is a plot of the mean pixel values of the XS3 (near infrared) band versus the XS2 (red) band for each class. The second graph is a plot of the mean pixel values of the XS2 (red) versus XS1 bands. The standard deviations of the pixel values for each class is also shown.
In the scatterplot of the class means in the XS3 and XS2 bands, the data points for the non-vegetated landcover classes generally lie on a straight line passing through the origin. This line is called the "soil line". The vegetated landcover classes lie above the soil line due to the higher reflectance in the near infrared region (XS3 band) relative to the visible region. In the XS2 (visible red) versus XS1 (visible green) scatterplot, all the data points generally lie on a straight line. This plot shows that the two visible bands are very highly correlated. The vegetated areas and clear water are generally dark while the other nonvegetated landcover classes have varying brightness in the visible bands. Spatial Feature ExtractionIn high spatial resolution imagery, details such as buildings and roads can be seen. The amount of details depend on the image resolution. In very high resolution imagery, even road markings, vehicles, individual tree crowns, and aggregates of people can be seen clearly. Pixel-based methods of image analysis will not work successfully in such imagery.In order to fully exploit the spatial information contained in the imagery, image processing and analysis algorithms utilising the textural, contextual and geometrical properties are required. Such algorithms make use of the relationship between neighbouring pixels for information extraction. Incorporation of a-priori information is sometimes required. A multi-resolutional approach (i.e. analysis at different spatial scales and combining the resoluts) is also a useful strategy when dealing with very high resolution imagery. In this case, pixel-based method can be used in the lower resolution mode and merged with the contextual and textural method at higher resolutions.
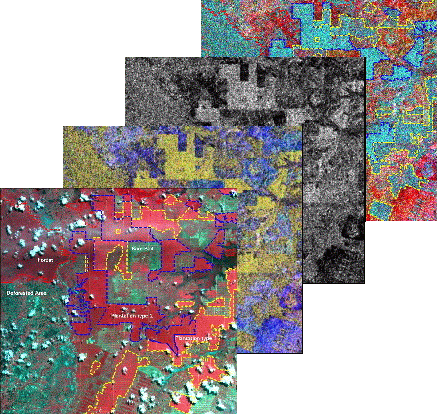
Measurement of Bio-geophysical ParametersSpecific instruments carried on-board the satellites can be used to make measurements of the bio-geophysical parameters of the earth. Some of the examples are: atmospheric water vapour content, stratospheric ozone, land and sea surface temperature, sea water chlorophyll concentration, forest biomass, sea surface wind field, tropospheric aerosol, etc. Specific satellite missions have been launched to continuously monitor the global variations of these environmental parameters that may show the causes or the effects of global climate change and the impacts of human activities on the environment.Geographical Information System (GIS)Different forms of imagery such as optical and radar images provide complementary information aboutthe landcover. More detailed information can be derived by combining several different types of images. For example, radar image can form oneof the layers in combination with the visible and near infraredlayers when performing classification.The thematic information derived fromthe remote sensing images are often combined with other auxiliary datato form the basis for a Geographic Information System (GIS). AGIS is a database of different layers, where each layer containsinformation about a specific aspect of the same area which isused for analysis by the resource scientists. Interpreting SAR Images   Go to Main Index Go to Main Index
| ||||||||||||||||||||||||||


