 |
 |
 Interpretation of Optical Images
 Interpreting Optical Remote Sensing Images
Four main types of information contained in an optical image are often utilized for image interpretation:
They are illustrated in the following examples. Panchromatic ImagesA panchromatic image consists of only one band. It is usually displayed as a grey scale image, i.e. the displayed brightness of a particular pixel is proportional to the pixel digital number which is related to the intensity of solar radiation reflected by the targets in the pixel and detected by the detector. Thus, a panchromatic image may be similarly interpreted as a black-and-white aerial photograph of the area. The Radiometric Information is the main information type utilized in the interpretation. A panchromatic image extracted from a SPOT panchromatic scene at a ground resolutionof 10 m. The ground coverage is about 6.5 km (width) by 5.5 km (height). The urban area at the bottom left and a clearing near the top of the image have high reflected intensity,while the vegetated areas on the right part of the image are generally dark. Roads and blocksof buildings in the urban area are visible. A river flowing through the vegetated area, cutting across the top right corner of the image can be seen. The river appears bright due to sediments while the sea at the bottom edge of the image appears dark. Multispectral ImagesA multispectral image consists of several bands of data. For visual display, each band of the image may be displayed one band at a time as a grey scale image, or in combination of three bands at a time as a colour composite image. Interpretation of a multispectral colour composite image will require the knowledge of the spectral reflectance signature of the targets in the scene. In this case, the spectral information content of the image is utilized in the interpretation.The following three images show the three bands of a multispectral image extracted from a SPOT multispectral scene at a ground resolution of 20 m. The area covered is the same as that shown in the above panchromatic image. Note that both the XS1 (green) and XS2 (red) bands look almost identical to the panchromatic image shown above. In contrast, the vegetated areas now appear bright in the XS3 (near infrared) band due to high reflectance of leaves in the near infrared wavelength region. Several shades of grey can be identified for the vegetated areas, corresponding to different types of vegetation. Water mass (both the river and the sea) appear dark in the XS3 (near IR) band. 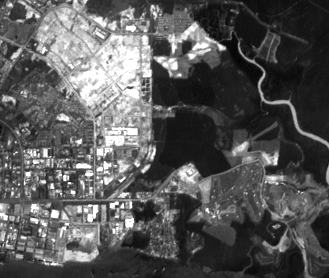 SPOT XS1 (green band) 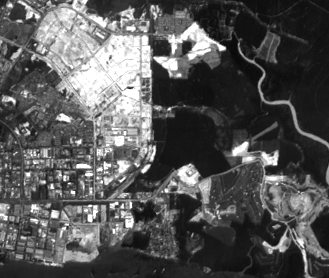 SPOT XS2 (red band)  SPOT XS3 (Near IR band) Colour Composite ImagesIn displaying a colour composite image, three primary colours (red, green and blue) are used. When these three colours are combined in various proportions, they produce different colours in the visible spectrum. Associating each spectral band (not necessarily a visible band) to a separate primary colour results in a colour composite image.
True Colour CompositeIf a multispectral image consists of the three visual primary colour bands (red, green, blue), the three bands may be combined to produce a "true colour" image. For example, the bands 3 (red band), 2 (green band) and 1 (blue band) of a LANDSAT TM image or an IKONOS multispectral image can be assigned respectively to the R, G, and B colours for display. In this way, the colours of the resulting colour composite image resemble closely what would be observed by the human eyes. 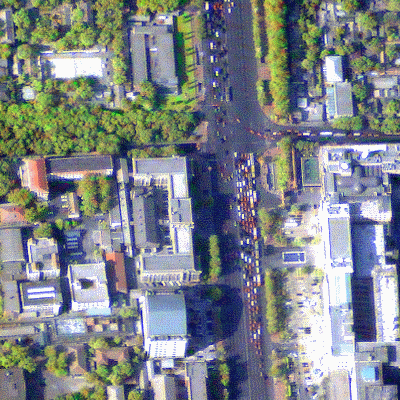 A 1-m resolution true-colour IKONOS image. False Colour CompositeThe display colour assignment for any band of a multispectral image can be done in an entirely arbitrary manner. In this case, the colour of a target in the displayed image does not have any resemblance to its actual colour. The resulting product is known as a false colour composite image. There are many possible schemes of producing false colour composite images. However, some scheme may be more suitable for detecting certain objects in the image. A very common false colour composite scheme for displaying a SPOT multispectral image is shown below: G = XS2 (red band) B = XS1 (green band) This false colour composite scheme allows vegetation to be detected readily in the image. In this type of false colour composite images, vegetation appears in different shades of red depending on the types and conditions of the vegetation, since it has a high reflectance in the NIR band (as shown in the graph of spectral reflectance signature). Clear water appears dark-bluish (higher green band reflectance), while turbid water appears cyan (higher red reflectance due to sediments) compared to clear water. Bare soils, roads and buildings may appear in various shades of blue, yellow or grey, depending on their composition.  False colour composite multispectral SPOT image: Red: XS3; Green: XS2; Blue: XS1 Another common false colour composite scheme for displaying an optical image with a short-wave infrared (SWIR) band is shown below: G = NIR band (SPOT4 band 3, Landsat TM band 4) B = Red band (SPOT4 band 2, Landsat TM band 3) An example of this false colour composite display is shown below for a SPOT 4 image. 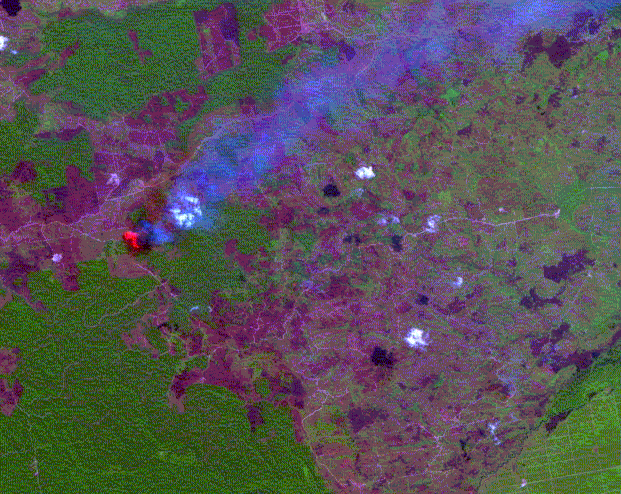 False colour composite of a SPOT 4 multispectral image including the SWIR band: Red: SWIR band; Green: NIR band; Blue: Red band. In this display scheme, vegetation appears in shades of green. Bare soils and clearcut areas appear purplish or magenta. The patch of bright red area on the left is the location of active fires. A smoke plume originating from the active fire site appears faint bluish in colour.  False colour composite of a SPOT 4 multispectral image without displaying the SWIR band: Red: NIR band; Green: Red band; Blue: Green band. Vegetation appears in shades of red. The smoke plume appears bright bluish white. Natural Colour CompositeFor optical images lacking one or more of the three visual primary colour bands (i.e. red, green and blue), the spectral bands (some of which may not be in the visible region) may be combined in such a way that the appearance of the displayed image resembles a visible colour photograph, i.e. vegetation in green, water in blue, soil in brown or grey, etc. Many people refer to this composite as a "true colour" composite. However, this term is misleading since in many instances the colours are only simulated to look similar to the "true" colours of the targets. The term "natural colour" is preferred. The SPOT HRV multispectral sensor does not have a blue band. The three bands, XS1, XS2 and XS3 correspond to the green, red, and NIR bands respectively. But a reasonably good natural colour composite can be produced by the following combination of the spectral bands: G = (3 XS1 + XS3)/4 B = (3 XS1 - XS3)/4 where R, G and B are the display colour channels. 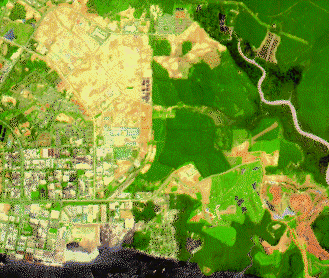 Natural colour composite multispectral SPOT image: Red: XS2; Green: 0.75 XS2 + 0.25 XS3; Blue: 0.75 XS2 - 0.25 XS3 Vegetation IndicesDifferent bands of a multispectral image may be combined to accentuate the vegetated areas. One such combination is the ratio of the near-infrared band to the red band. This ratio is known as the Ratio Vegetation Index (RVI)Since vegetation has high NIR reflectance but low red reflectance, vegetated areas will have higher RVI values compared to non-vegetated aeras. Another commonly used vegetation index is the Normalised Difference Vegetation Index (NDVI) computed by  Normalised Difference Vegetation Index (NDVI) derived from the above SPOT image In the NDVI map shown above, the bright areas are vegetated while the nonvegetated areas (buildings, clearings, river, sea) are generally dark. Note that the trees lining the roads are clearly visible as grey linear features against the dark background. The NDVI band may also be combined with other bands of the multispectral image to form a colour composite image which helps to discriminate different types of vegetation. One such example is shown below. In this image, the display colour assignment is: G = (XS3 - XS2)/(XS3 + XS2) (NDVI band) B = XS1 (green band)  NDVI Colour Composite of the SPOT image:Red: XS3; Green: NDVI; Blue: XS1. At least three types of vegetation can be discriminated in this colour composite image: green, bright yellow and golden yellow areas. The green areas consist of dense trees with closed canopy. The bright yellow areas are covered with shrubs or less dense trees. The golden yellow areas are covered with grass. The non vegetated areas appear in dark blue and magenta. Textural InformationTexture is an important aid in visual image interpretation, especially for high spatial resolution imagery. An example is shown below. It is also possible to characterize the textural features numerically, and algorithms for computer-aided automatic descrimination of different textures in an image are available.
Geometric and Contexture InformationUsing geometric and contextual features for image interpretation requires some a-priori information about the area of interest. The "interpretational keys" commonly employed are: shape, size, pattern, location, and association with other familiar features. Contextual and geometric information plays an important role in the interpretation of very high resolution imagery. Familiar features visible in the image, such as the buildings, roadside trees, roads and vehicles, make interpretation of the image straight forward.  This is an IKONOS image of a container port, evidenced by the presence of ships, cranes, and regular rows of rectangular containers. The port is probably not operating at its maximum capacity, as empty spaces can be seen in between the containers.  This SPOT image shows an oil palm plantation adjacent to a logged over forest in Riau, Sumatra. The image area is 8.6 km by 6.4 km. The rectangular grid pattern seen here is a main characteristic of large scale oil palm plantations in this region. 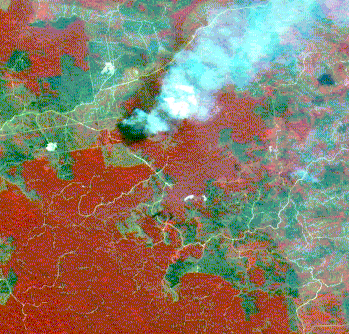 This SPOT image shows land clearing being carried out in a logged over forest. The dark red regions are the remaining forests. Tracks can be seen intruding into the forests, implicating some logging activities in the forests. The logging tracks are also seen in the cleared areas (dark greenish areas). It is obvious that the land clearing activities are carried out with the aid of fires. A smoke plume can be seen emanating from a site of active fires. Optical Remote Sensing   Infrared Remote Sensing Infrared Remote Sensing Go to Main Index Go to Main Index |


